1Q2023 Safety Performance Update
Let’s take a quick look at our safety stats to see how we ended the first quarter of the year.
Leading Safety Indicators
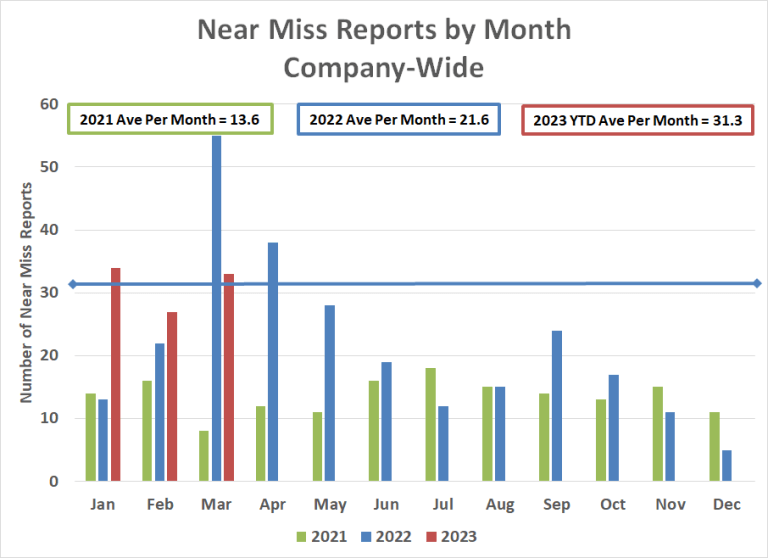
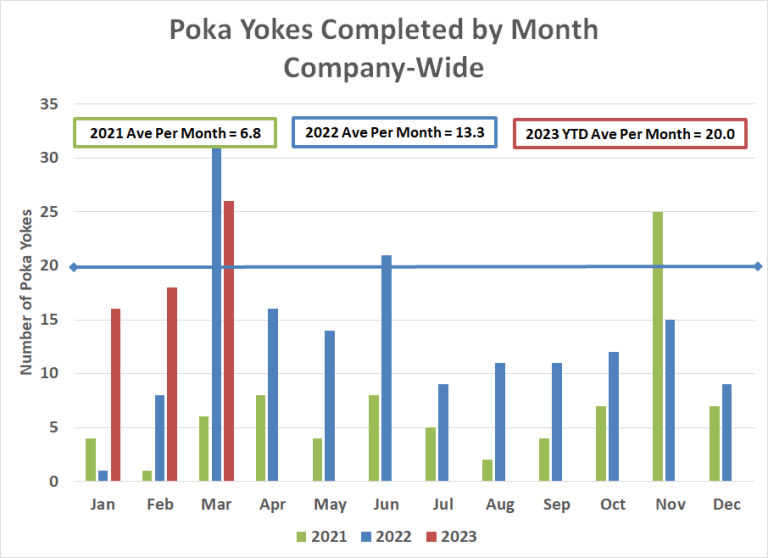
Leading Safety Indicators are what we do PRIOR TO an incident to help us identify or reduce a safety risk. These things are Key Activity Indicators (KAI), sharing best practices, Operational Learning and Incident Prevention…our near miss reporting and poka yokes (mistake-proofing activities)!
In the first quarter of the year, we’ve reported more near misses and completed more poka yokes than any other quarter to date! Congratulations!
- Near Misses – 94 near miss events reported in 1Q2023 vs 90 reported in 1Q2022
- Poka Yokes – 60 poka yokes completed in 1Q2023 vs 42 completed in 1Q2022.
Leading Safety Indicators
Lagging Safety Indicators are our occupational injuries and illnesses. We’re not off to a great start in 2023, but there’s still time to acknowledge and adjust what we’re doing.
- 27 OSHA Recordable events in 1Q2023 vs 20 in 1Q2022
- 19 DART (Days Away, Restricted or Transferred) events in 1Q2023 vs 13 in 1Q2022
We can us this information to help us learn and improve. What can we do to reduce our risks and improve safety across the Company? Attend your safety meetings and trainings. Report risks and hazards. Share your ideas and be part of the implementation process.
Questions?
- Reach out to your Safety contact or Tony Dominic, Director – Safety, Health, Environment, at Tony.Dominic@olysteel.com.
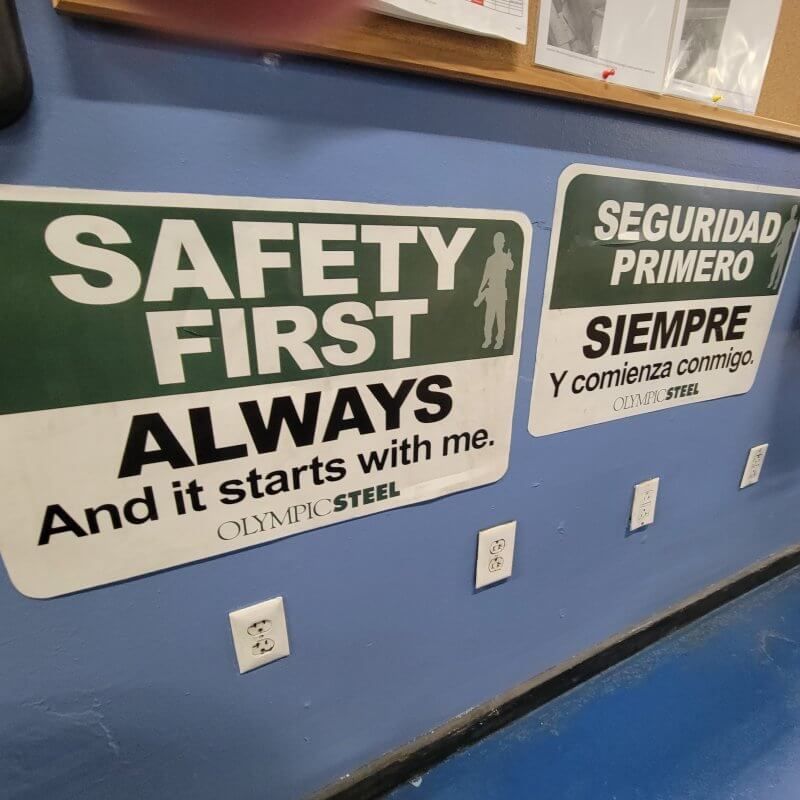
Safety First. Always. And, it starts with me.