Safety Stats: 101
The subject is Safety, and class is in session!
Since March 2021, our monthly Safety Stats: 101 ‘courses’ (see below) have been shared to develop your understanding of important, frequently used Safety terms.
These terms are described in this article, on posters displayed in our facilities and further explained in monthly Safety training.
Unlike most classes, you won’t be tested on how much you’ve learned from these courses. The real test is in your use and understanding of these key terms – when you do your job, when you participate in Safety training or maybe even when you identify an opportunity for a process improvement.
As we head into 2022, we’re On the Move – thinking bigger and planning better. While you’re preparing for 2022 and planning for the year ahead, think about how your function can have an impact on Safety.
How can you help reduce our Lagging Indicators?
How can you be more engaged in Safety training?
What steps can you take each day to put Safety First, Always?
With these questions in mind, give the subjects below a quick review and get started preparing your plans to put Safety First in 2022. Because, it starts with you.
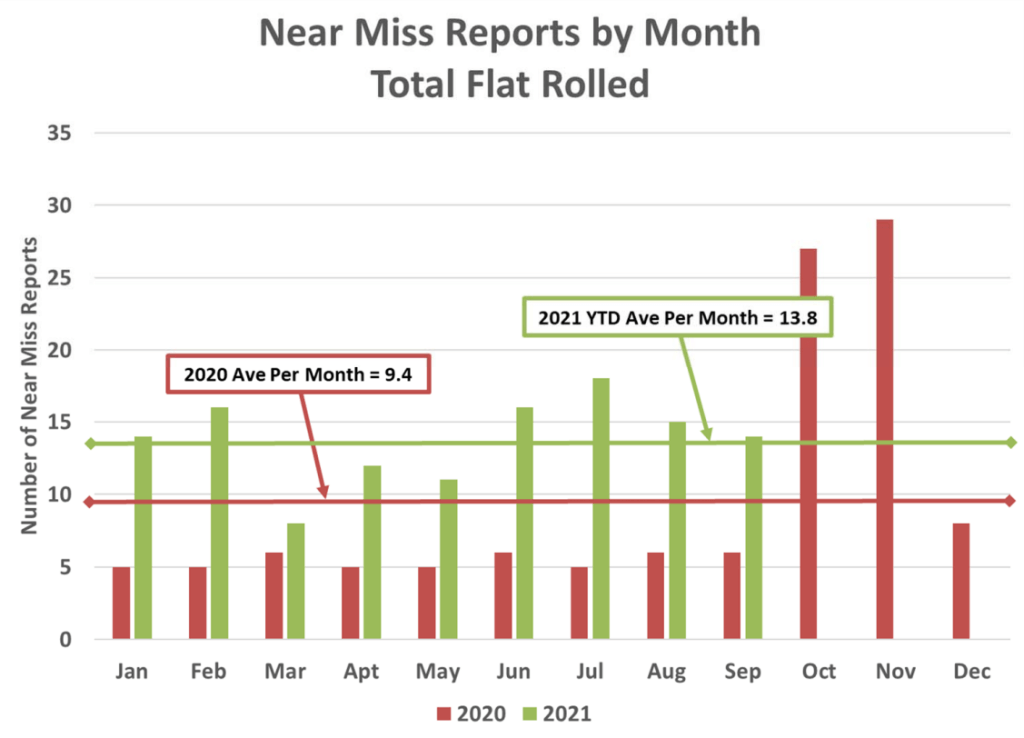
NEAR MISS & HIGH POTENTIAL NEAR MISS REPORTING
What is a Near Miss or High Potential Near Miss?
A near miss is an unintentional incident that could have caused damage, injury or death, but was narrowly avoided. When an incident or near miss could have resulted in death or serious occupational injury (amputation, paralysis, etc.), the event is called a high potential near miss. Reporting near misses is the process of collecting data from the incident and analyzing the information to determine root cause.
How do we use these reports at Olympic Steel?
Reporting near misses and high potential near misses is a key factor in preventing similar incidents in the future. These events typically happen because of a breakdown in a process or procedure. Thoroughly reviewing all aspects of the incident can provide insight to what should be done in the future to prevent the incident from occurring again.
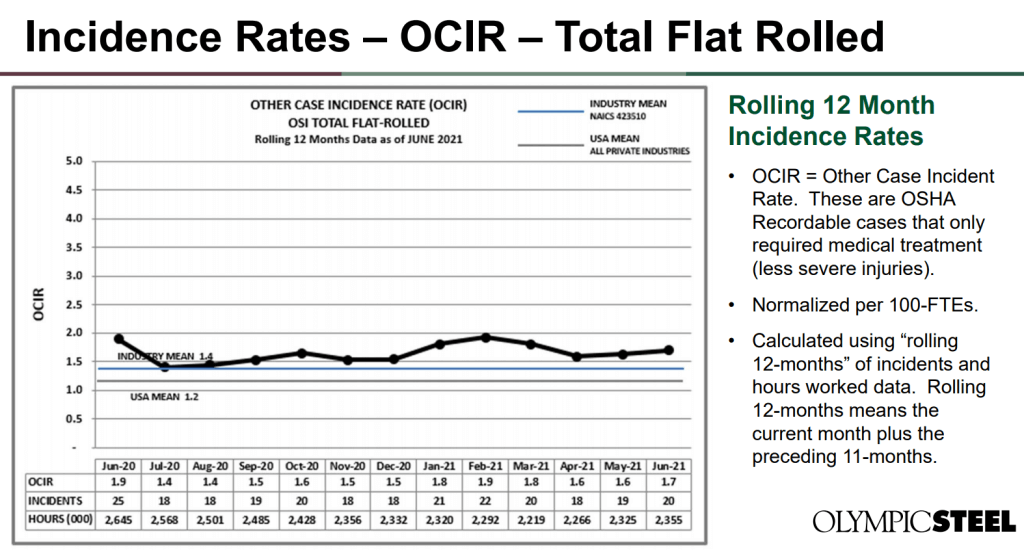
OTHER CASE INCIDENT RATE (OCIR)
What is the Other Case Incident Rate?
Other Case Incident Rate is a component (subset) of the Total Recordable Incident Rate (TRIR). It includes incidents and illnesses that ONLY require medical treatment. These events are less severe and don’t result in work restrictions or days away from work.
How do we use this term at Olympic Steel?
We track our Other Case Incident Rate the same way we track all recordable injuries – using a rolling 12-months of incidents and hours worked data. When comparing data from June 2020 to June 2021, we reported 5 less incidents during that time, decreasing our OCIR from 1.9 to 1.7.
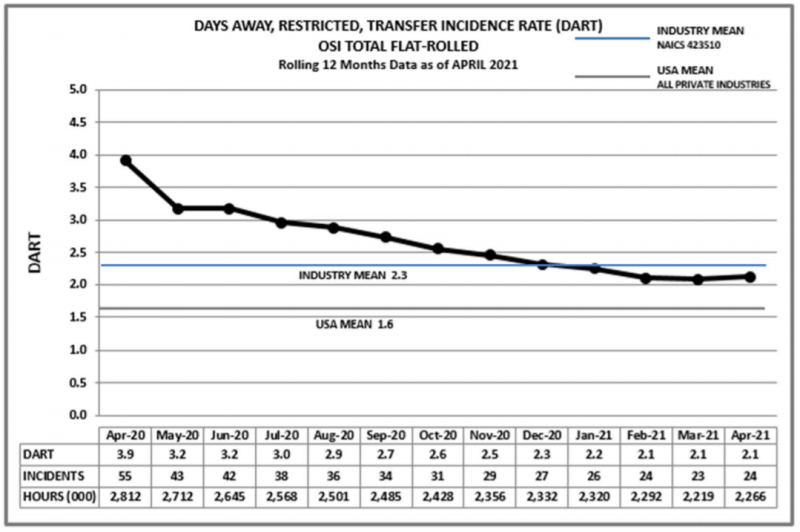
In our industry, the average DART incident rate is 2.3. Our most recent DART incident rate, using data through April 2021, is 2.1. In 2021, our DART incident rate has been below the industry average and our lowest recorded DART rate in recent history.
KEY ACTIVITY INDICATORS
Over the last two months, you’ve learned about Leading Indicators, Lagging Indicators and Key Performance Indicators. This month, we round out that group of important measures with an explanation of Key Activity Indicators (KAI).
What are Key Activity Indicators?
Key Activity Indicators (KAI) are Leading Indicators, or the proactive and preventive measures we take to learn more about the effectiveness of our Safety activities, often revealing potential issues.
Our Key Activity Indicators center around identifying unsafe conditions or unsafe acts through near miss reporting.
How do we use this term at Olympic Steel?
Key Activity Indicators are referenced as Leading Indicators. Divisions complete near miss reports that identify potential issues and share best practices to correct or eliminate unsafe conditions throughout the organization.

KEY PERFORMANCE INDICATORS
In March, you learned about Leading and Lagging Indicators. This month we’re referencing those two terms as we learn about Key Performance Indicators.
What are Key Performance Indicators?
Key Performance Indicators (KPIs) are the measurable values we use to evaluate our progress toward meeting our Safety objectives.
Our Key Performance Indicators include:
- OSHA Recordable Injuries
- Other Case Incident Rate (OCIR)
- Days Away, Restricted or Transferred (DART)
How do we use these terms at Olympic Steel?
Our Key Performance Indicators are tracked on a rolling 12-month calendar. This means our data is always the most recent from the past 12-months. We compare our current month of data to the same month the previous year to identify if we’re making progress.
TOTAL RECORDABLE INCIDENT RATE (TRIR)
What is the Total Recordable Incident Rate?
Total Recordable Incident Rate is a standard injury rate used for all industries so OSHA can easily compare injury/illness statistics to determine the effectiveness of safety programs. The rate does not predict future incidents, but it does give us an accurate overview of past performance.
How do we use this term at Olympic Steel?
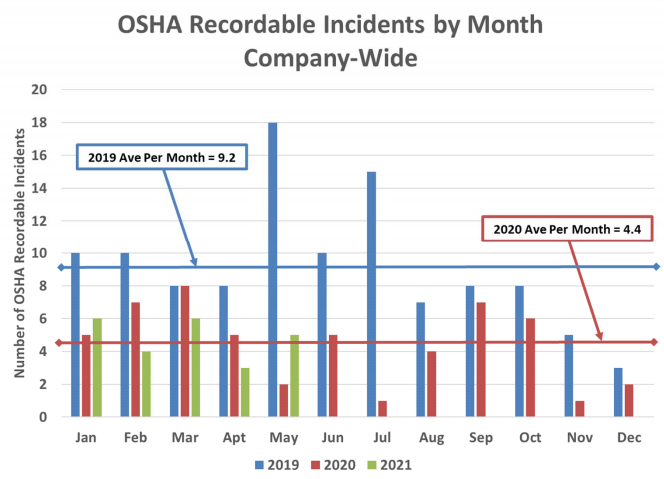
When someone reports a work-related injury/illness beyond first aid, we’re collecting data to calculate our Total Recordable Incident Rate. We calculate our Total Recordable Incident Rate using a rolling 12-month rolling calendar. That means we use data for the current month plus the preceding 11 months to calculate our rate. The rate is only effective when we accurately record injuries and illnesses. Here’s a monthly comparison of our TRIR since 2019:
DART – DAYS AWAY, RESTRICTED OR TRANSFERRED
What is DART?
DART – Days Away, Restricted or Transferred – is a safety metric used by the U.S. Occupational Safety and Health Administration, OSHA, to show how many workplace injuries and illnesses caused the affected employees to stay away from work, restricted their work activities or resulted in a transfer to another job because they were unable to do their usual job.
How do we use this term at Olympic Steel?
A DART incident rate is calculated by multiplying the total number of incidents by 200,000 and then dividing by the total number of hours worked. Olympic Steel uses a rolling 12-months to determine hours worked and number of incidents. This means we use the current month’s data, plus the previous 11 months of data, to find the total number of incidents and the total hours worked.
LEADING & LAGGING INDICATORS
What are Leading and Lagging Indicators?
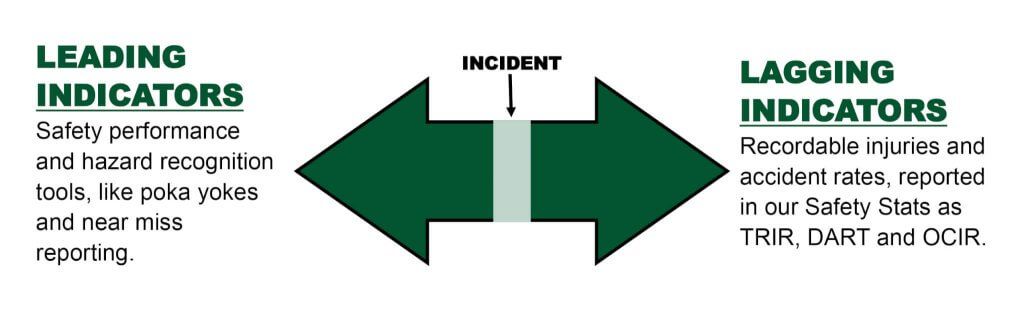
Leading Indicators are proactive measures that track data related to prevention efforts and can be observed and recorded prior to an injury – what did we know/do to stop an accident.
Lagging Indicators are reactive measures that track outcomes, such as an injury, once it has already occurred – what did we discover/do after an accident occurred.
How do we use these terms at Olympic Steel?
- Leading Indicators that help us identify and reduce risks before an injury happens are poka yokes and near miss reporting. These tools help us avoid errors and mistake-proof our processes to reduce our risks and prevent incidents from occurring. Click here to read more about how we’ve put these mistake-proofing tools into action.
- Lagging Indicators that we track include Total Recordable Incident Rate (TRIR), Days Away, Restricted or Transferred (DART) and Other Case Incident Rate (OCIR)/Medical Only cases. (More on these stats in the months ahead!) Our OSI Total Flat-rolled statistics through January 2021 are as follows:
- January 2021 TRIR is 4.1, down 2.6 from January 2020
- January 2021 DART is 2.2, down 2.0 from January 2020
- January 2021 OCIR is 1.9, down 0.6 from January 2020
Where can you learn more?
Get more details about these terms from the Monthly Safety Stats, published on IamOlympicSteel.com, and by reading the materials posted to your communication boards at the division. And, you can always ask your Supervisor or divisional Safety expert for more information.
Safety First. Always. And, it starts with me.